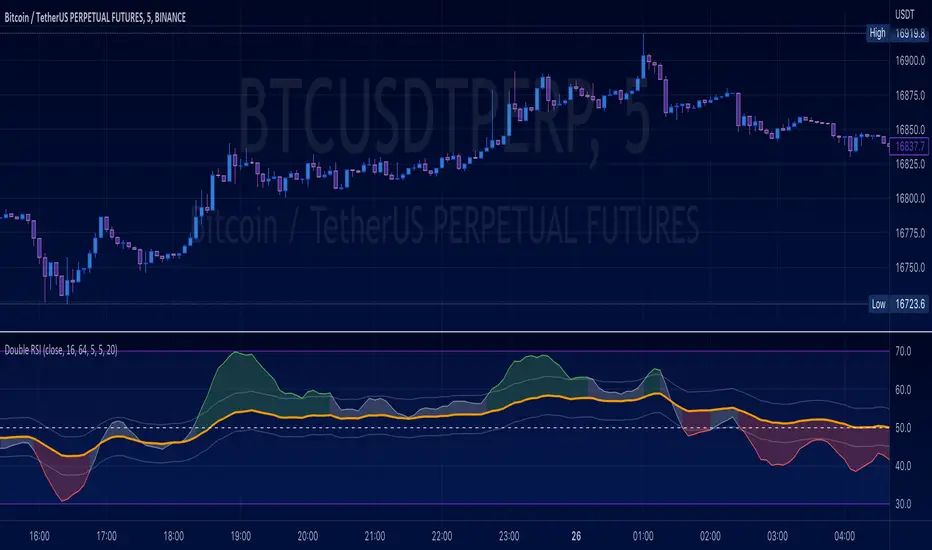
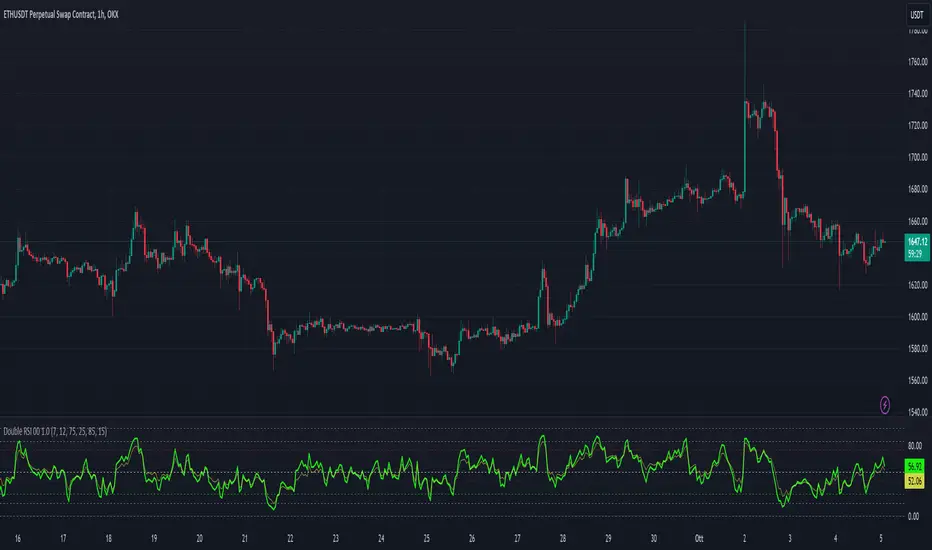
Double RSIDouble RSI (DRSI) Indicator
The Double RSI (DRSI) is a technical analysis tool designed to provide traders with enhanced buy and sell signals by identifying uptrend and downtrend thresholds. It refines traditional RSI-based signals by applying a "double calculation" to the Relative Strength Index (RSI), improving precision in detecting trend changes.
Key Concepts Behind the Indicator
1. Double RSI Calculation
The DRSI indicator takes the standard RSI (calculated using the closing price over a specified length) and applies a second RSI calculation to it. This creates a smoother, more refined RSI value, making it more effective at highlighting the general trend of the market.
RSI: Measures the strength of recent price movements, ranging from 0 to 100.
Double RSI (DRSI): Applies the RSI formula to the RSI values themselves, smoothing out fluctuations and generating clearer signals.
How Does the Indicator Work?
The DRSI identifies uptrends and downtrends using two user-defined thresholds:
Uptrend Threshold (Default = 59): A value above this threshold signals a potential shift into an uptrend.
Downtrend Threshold (Default = 52): A value below this threshold signals a potential shift into a downtrend.
Signal Generation
Buy Signal: A crossover occurs when the DRSI value crosses above the Downtrend Threshold, signaling the beginning of an upward movement.
Sell Signal: A crossunder occurs when the DRSI value crosses below the Uptrend Threshold, signaling the beginning of a downward movement.
Customizable Inputs
The indicator offers customizable settings for increased flexibility:
DRSI Length (Default = 13): Determines the lookback period for RSI calculations. A shorter length increases sensitivity, while a longer length smooths the signals.
Uptrend Threshold (Default = 59): Sets the level above which an uptrend is confirmed.
Downtrend Threshold (Default = 52): Sets the level below which a downtrend is confirmed.
Bar Color and Glow Effects: Traders can enable colored candles or glowing DRSI lines for better visual representation.
Why is This Indicator Useful for Traders?
1. Noise Reduction
By applying a second RSI calculation, the DRSI smooths out minor fluctuations and highlights the overall trend.
2. Clear Uptrend and Downtrend Signals
The indicator provides intuitive buy (green arrow) and sell (red arrow) markers, simplifying decision-making.
3. Customizable Thresholds
Traders can adjust the thresholds and length to better suit specific trading strategies or market conditions.
4. Bar Coloring
Bars are color-coded to indicate the trend:
Green (Above Uptrend Threshold): Indicates an uptrend.
Red (Below Downtrend Threshold): Indicates a downtrend.
How the Indicator Appears on the Chart
DRSI Line: A smooth line derived from the double RSI calculation.
Threshold Lines: Two horizontal lines (green for the Uptrend Threshold, red for the Downtrend Threshold) to visualize trend changes.
Colored Candles: Candlesticks dynamically change color based on the trend direction (green for uptrends, red for downtrends).
Buy/Sell Markers:
Buy Signal: A green upward triangle below the bar, marking the start of an uptrend.
Sell Signal: A red downward triangle above the bar, marking the start of a downtrend.
In Summary
The Double RSI (DRSI) indicator is a powerful tool for identifying uptrends and downtrends with:
Smoothed trend detection using double-calculated RSI values.
Clear, actionable buy and sell signals.
Customizable settings to match different trading styles.
By focusing on trend thresholds rather than overbought or oversold levels, the DRSI provides traders with precise, noise-free signals to optimize their trading decisions.
Search in scripts for "double rsi"

Double RSI/LSMA Double RSI uses a Slow RSI combined with a Fast RSI to generate Buy and Sell signals. Least Squares Moving Average is only here for filtering signals. It is very good on certain stocks or ETFs on longer timeframes for swing trading. If you get a Buy signal look at the LSMA trend and if the candle is above the LSMA. It works great for me on lower timeframes scalping futures and on higher timeframes swinging options. It is better than paying for Buy and Sell signals. Its my first script/indicator so play with it and see what you think. Let me know if you guys find anything that makes it better. Hopefully this helps some traders out there.
Double RSI For KateDouble RSI for scalping and trend recognition. Green for longs, red for shorts. Based on close. ;)

Double RSI + BBRSI stands for Relative Strength Index.
Bollinger Bands stands for a channel open by standard deviation values plotting upper, lower lines.
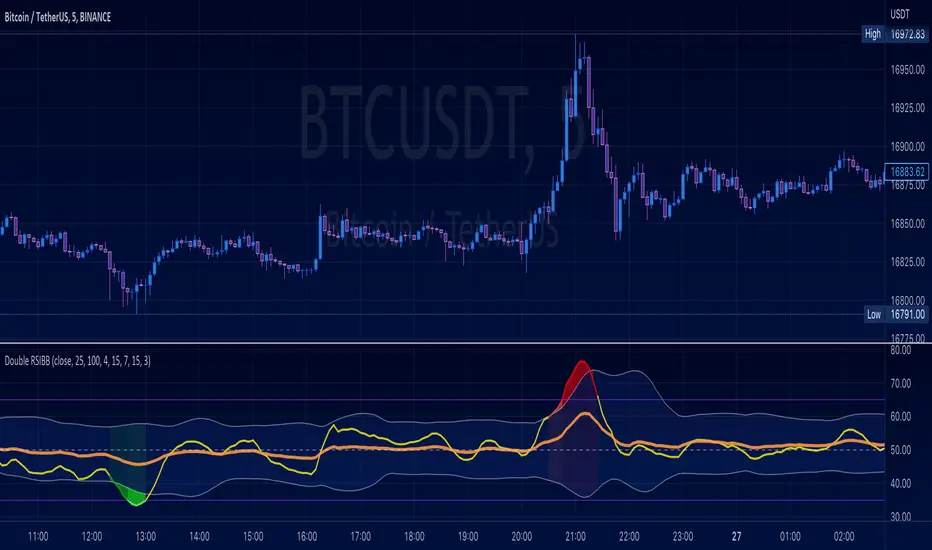
Double RSI with Bollinger bands adapted Bollinger bands to RSI not using overlay mode. It tries to filter fake signals while giving more good signals according to volatility even below overbought areas or above oversold areas. This way you can use greater values for RSI, like 25 and 100, increasing smoothness with less market noise.
We added an extra gap spacer to smooth Bollinger bands while widening the channel with a lower multiplier.
I found better results when Fast RSI crosses back into Bollinger bands channel.
You can play with the following settings:
• Source
Close is the most used
• Fast RSI length
Default to 25
• Slow RSI length
Default to 100
• RSI Smoothing
To filter out some graphic noise
• RSI Overbought, Oversold
Regular overbought, oversold lines handled by a single value. For 70/30, set it to 20 although with longer RSI something around 15 is enough.
• Bollinger Spacer
Ads thickness to the channel with lower multiplier
• Bollinger Length
Regular Bollinger length applied to slow RSI
• Bollinger Multiplier
Regular Bollinger multiplier applied to slow RSI
Disclaimer:
For study purposes only, trading without a good risk management can be regrettable, do your own research, always add confirmations, use it as is, at your own risk.
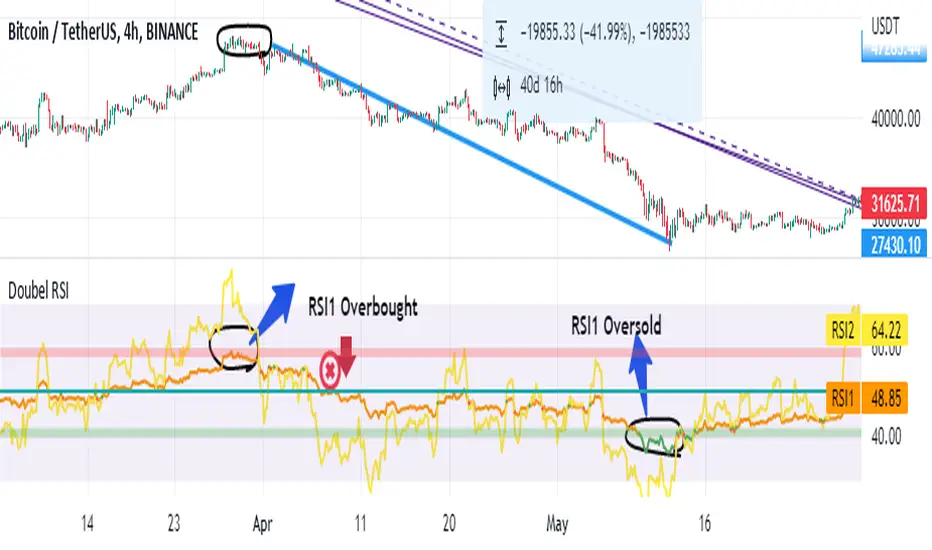
Double RSI OscillatorThe Double RSI Oscillator
Hello Gs,
I came back from the dead and tried to see what a little tweak to RSI could do, and I think it is quite interesting and might be worth checking out.
Warning:
This indicator has lots of false signals unfortunatly
How does the DRSI Oscillator work?
Very simple, the DRSI oscillator at the very base is just 2 RSIs that should smooth each other out, making a smoother trend signal generation for trend analysis. One RSI is set to have lower values, by considering the lowest point of the price, and one RSI is set to have higher values using pretty much the same thing. The trend changes from positive to negative if RSI with higher values crosses negative treshhold, and from negative to positive if RSI with lower value crosses positive treshhold. On top of this I added some additional settings to smooth or speed it further, if these were a good idea, I guess only time will tell :D.
Settings
Here is a guide of what setting changes what and how it might be suitable for you:
RSI Optimism length: length of the RSI with higher values (higher values will be better for longer term, lower for medium term)
RSI Pesimism length: length of the RSI with lower values (higher values will be better for longer term, lower for medium term)
Positive treshhold: The value RSI pesimism needs to pass in order to change trends (in case of using RSI avg. the value the average needs to pass), making this higher can give you faster signals, but expect more false ones
Negative treshholds: The value RSI optimism needs to pass in order to change trends (in case of using RSI avg. the value the average needs to pass), lowering this can give you faster signals, but expect more false ones
Smoothing type: Select the type of smoothing (or none) to smooth your signals as you want, this one you need to play around with.
Smoothing length: The length of your smoothing method (if none is selected it wont change anything)
Use RSI average instead: self-explanatory, go figure
Above/Below Mean Trend: Changes the way trend logic works
Why consider using this indicator?
The DRSI Oscillator is a tool that has huge flexibility (due to tons of settings that base RSI doesnt, like trend treshholds), and is smoother allowing traders and investors to get high quality or high speed signals, allowing great entries and exits
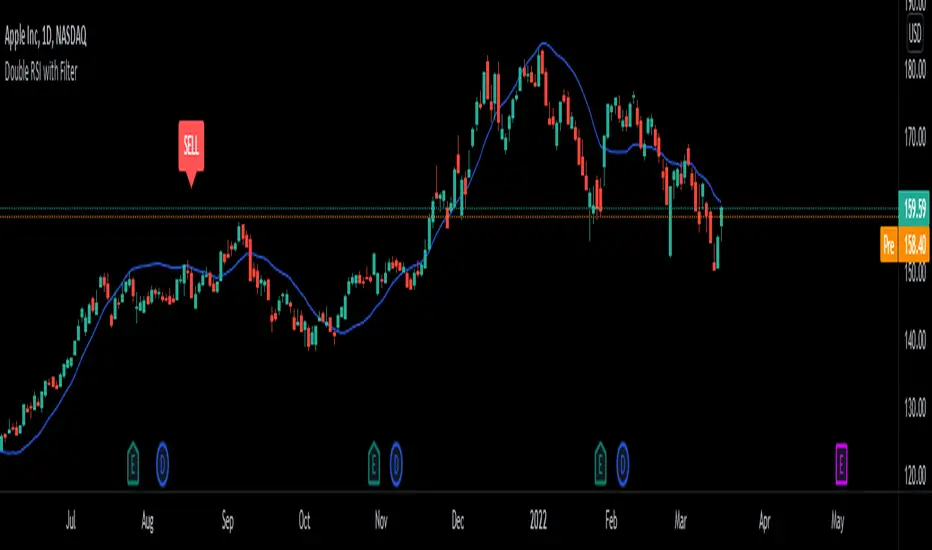
Double RSI TrendThis is my Double RSI Trend Indicator. It issues Buy and Sell signals based on the Supertrend and a double RSI . The RSIs cross near or at the same time as the Supertrend fires. It has the ability to change if you want signals based on the RSI cross on the same candle, one candle before, and two candles before. I find this one extremely good at catching reversals as long as you filter out some of the signals based on trend.

Double RSI - Non-overlay (Unmerged)Edit of DiZer's Double RSI, but defaulted as Unmerged, instead of a merged overlay
Double RSI for strategy forum.binguru.net/viewtopic.php?id=1236

Double RSIThis is double RSI script which plots one time frame higher RSI along with the current time frame i.e
For Weekly chart it display Weekly and Monthly RSI
For Daily chart it display Daily and Weekly RSI
For Intraday chart it display Intraday and Daily RSI.
Usage:
If Daily RSI is above 60 and weekly above 40 and moving up then stock is in a good uptrend look for buying when Daily takes support at 60. Usually First test of Daily produces a good entry for subsequent entries probability decreases.
For Downtrend look for Daily RSI below 40 and weekly below 60.
Double RSI Fast & Slow
Double RSI, fast & Slow.
This indicator is intended to track trends based on RSI with a threshold for proximity.
Oversold, overbought channel.
Threshold for proximity.
Color coded line values.
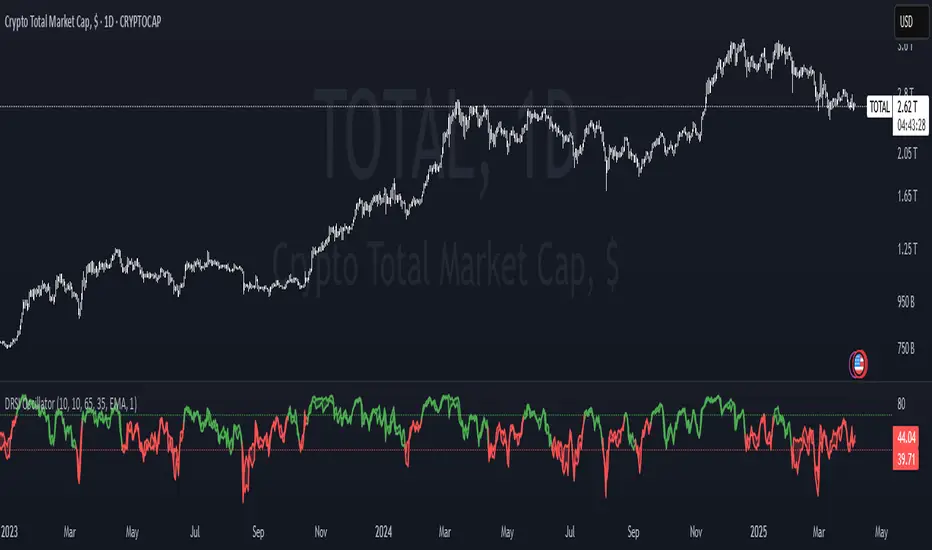
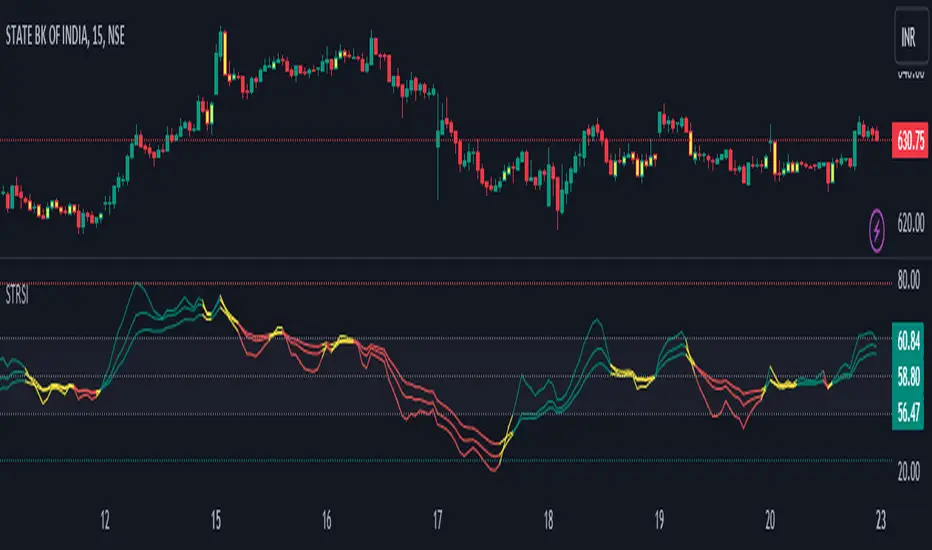
Double Relative Strength Index (Double RSI)# Double Relative Strength Index (Double RSI) Indicator
The Double Relative Strength Index (Double RSI) is a custom trading indicator for the TradingView platform. It provides traders with two Relative Strength Index (RSI) bands, a fast RSI, and a slow RSI, which can be helpful in identifying potential entry and exit points in the market.
## Features
- **Uses 2 RSI Bands:** The indicator displays two RSI lines on the chart, providing insights into the short-term and long-term strength of the asset's price movement.
- **Fast and Slow RSI:** The fast RSI uses a shorter length, while the slow RSI uses a longer length, allowing traders to observe different time frames of price momentum.
- **Smoothing:** To reduce noise and improve the readability of the RSI lines, the indicator offers multiple smoothing options such as RMA, SMA, EMA, WMA, and HMA.
- **Crossover and Crossunder Signals:** The indicator identifies potential trading signals when the fast RSI crosses above or below the slow RSI. These events are visually highlighted on the chart with color-coded candlesticks.
- **RSI Bands:** The indicator also includes colored bands that represent different RSI levels, such as 80%, 75%, 60%, 50%, 45%, 25%, and 20%. These bands help visualize the RSI's current position relative to overbought and oversold conditions.
## How to Use
1. Add the "Double RSI" indicator to your TradingView chart.
2. Customize the input parameters according to your preferences, such as the lengths of the fast and slow RSIs and the smoothing method.
3. The indicator will display two RSI lines on the chart, each with its own color.
4. Look for crossover events where the fast RSI line crosses above the slow RSI line, indicating a potential bullish signal.
5. Watch for crossunder events where the fast RSI line crosses below the slow RSI line, indicating a potential bearish signal.
6. The colored bands represent different RSI levels. When the RSI is in the overbought (high) or oversold (low) regions, it may suggest a potential reversal in price direction.
## Disclaimer
Please remember that the Double RSI indicator is provided for informational purposes only and should not be considered as financial advice or a standalone trading strategy. Always perform your own research, use additional tools and indicators, and consider risk management techniques before making any trading decisions.
**Note:** This code is subject to the terms of the Mozilla Public License 2.0. For more details, refer to the (mozilla.org).
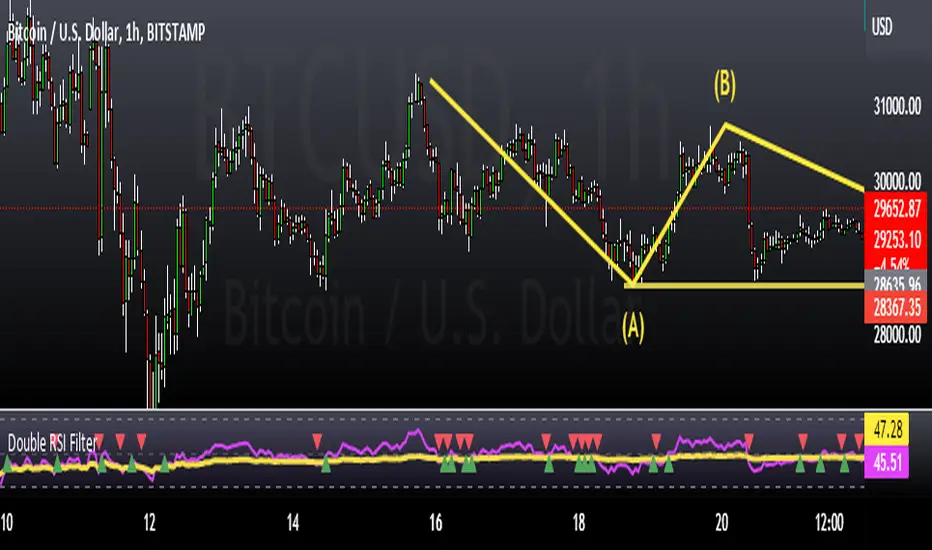
Double RSI FilterI've seen several youtubers using 2 RSI's on top of one another to filter trades for their strategies. I figured I would just code it up as an all-in-one indicator for people who have the basic package. This way they have an extra slot for another indicator if they need one and also for convenience.
Longs only when RSI 1 is above RSI 2 and shorts only when opposite. The arrows show where crosses of the RSI's occur.
Let me know if there is something else like this where it would just be very convenient to have 2 indicators on one window or other such things and I'll see if I can do something for you guys in my spare time. I'm just an amateur coder, but learning as I do more of these for people.
Thank you!
Hope this helps someone! :)
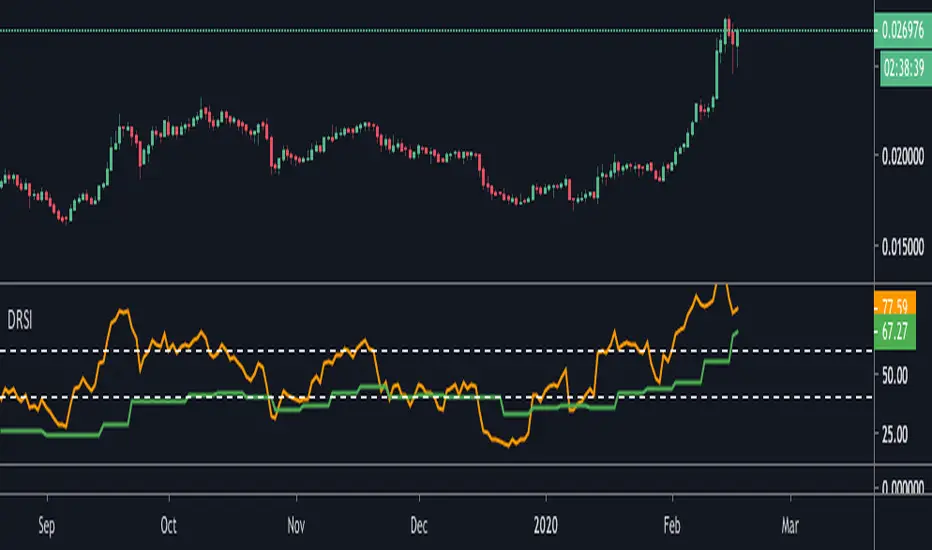
Double Relative Strength IndexDouble RSI plotted at 14 and 2 lengths simultaneously, and with different oversold/overbought limits.
RSI 14 is great for detecting divergence/convergence between the price and RSI action, whilst RSI 2 add timing accuracy in trade entry.
DOUBLE RSI+MA ALERTS SETUPThis is an indicator that provides two verses of relative force indices (RSI) - an RSI Rapid and an RSI Normal, but as moving media (MA) applied with an RSI Rapid for suavização.
Rapid RSI and Normal RSI:
Or RSI is a momentum indicator that mediates the speed and alteração of preço movements of an ativo. No script, we calculate the RSI variations:
O RSI Rápido, com um período configurável que por padrão é but curto (5 períodos), para reactor but quickly to these mudanças no preço.
Or RSI Normal, with a configured period, but with a maximum value (14 periods), proportionate to an analysis but correct.
Media Móvel do RSI Rápido:
We have a simple mobile media (SMA) application with RSI Rapido, using the same number of times as RSI to monitor variations and facilitate viewing of the direction of the trend.
Levels of Overbought and Oversold:
These are the levels of overbought (sobrevendido) and oversold (sobrecomprado). Therefore, the overbought level is set at 80 and the overbought level is 20, depending on the classic RSI settings.
Alert Conditions:
Criamos alert conditions to inform you when the RSI of each type is ultrapassed or they are not defined as overbought and oversold. Assim, we can be notified of potential entry points or conditions based on these extreme market conditions. These messages are personalized to ensure that you quickly identify when the RSI has disappeared or alerted you if it is an overbought or oversold condition.
Visualization Graphic:
The indicator plots as RSI Rapid and RSI Normal lines not graphically for visual analysis, but with horizontal lines indicating the level of overbought and oversold. A cor dessas linehas éjustável para clareza.
Informative Table:
The tab is added to the lower side of the graphic fornecendo values at the real time of the RSI Fast as the RSI Normal, making it easier to visualize quickly and to compare unless it is necessary to print directly for the graphic.
This script has a powerful ferrament for operators that provides integrated analysis of RSI into its strategies, offering flexibility to monitor the dynamics of the preço and different tempo scales. Personal alerts are particularly important to be aware of marketing conditions without the need for constant monitoring. Algum additional functionality that you find useful or extra personalization that you want?

Double RSI 00 1.0This script creates a custom indicator, visualizes two RSI values (RSI1 and RSI2) on the chart and generates alerts based on different RSI-related conditions, which can be used for technical analysis and trading strategies. Users can customize the RSI parameters and alert levels according to their preferences.
It includes several input parameters that allow the user to customize the RSI calculations and overbought/oversold levels. These parameters include:
length_1: RSI1 Length (default: 7)
length_2: RSI2 Length (default: 12)
overbought_1: Overbought Signal level for RSI1 (default: 75)
oversold_1: Oversold Signal level for RSI1 (default: 25)
overbought_2: High Overbought Signal level for RSI1 (default: 85)
oversold_2: High Oversold Signal level for RSI1 (default: 15)
The script calculates two RSI values: rsi_1 and rsi_2, based on the high and low prices averaged (hl2) and the specified RSI lengths.
It plots these RSI values on the chart using different colors and line widths.
Several horizontal lines are drawn on the chart to represent key levels:
h0: 0 (Lower Band)
h1: 50 (Middle Band)
h2: 100 (Upper Band)
h3: The Oversold level (customizable)
h4: The Overbought level (customizable)
h5: The High Oversold level (customizable)
h6: The High Overbought level (customizable)
The script defines alert conditions for various signals, including overbought, oversold, high overbought, high oversold, long (crossover between RSI1 and RSI2), and short (crossunder between RSI1 and RSI2).
It sends alerts when these conditions are met, indicating potential trading signals.
Please note that this script is meant for educational purposes and should be used cautiously in a real trading environment. It's important to have a thorough understanding of technical analysis and risk management when using such indicators in actual trading.
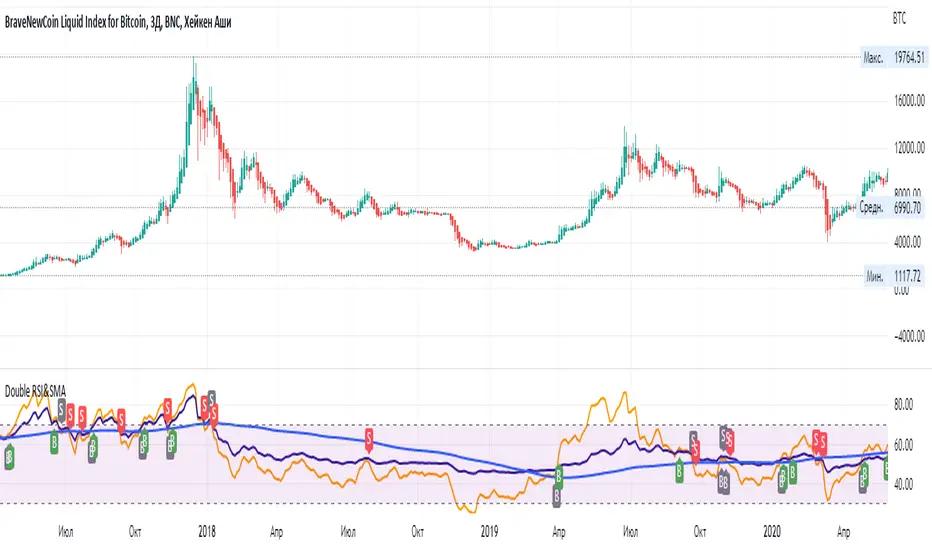
Double RSI & SMAFast and Slow RSI plus SMA in one indicator are used for detection of trend change. Have not seen it earlier in one indiator.
Added signals and alerts for even better usability.
See how it showed BTC lows in 2018: on 3d TF with Heiken Ashi candles low of fast RSI is the botton of the downtrend, while flat did not ended while SMA did not changed direction upwards. Looking for the botton of the current cycle.
Double RSI Momentum2 RSI , one is 14 period and the second 5 period (adjustable). The Momentum is the difference of the 2 rsi. It s moves around the zero line, and when there is a peak out , inversion should come soon. You can adjuste the lower and upper bands.

Dragon Double RSIMost important thing is feeling inspired and relaxed. Forcing your way into anything under stress and pressure will only end up in disaster
This indicator consists of three RSIs.
RSI: RSI is common and its length is 14.
RSI 1: The slowest RSI. The length is 100.
RSI 2: Faster than RSI 1. The length is 50.
Hamid Double RSIRSI with Moving Average and Another RSI
This script combines two Relative Strength Index (RSI) indicators with configurable moving averages. It allows traders to track momentum and market strength with adjustable periods for both the RSI and moving averages. The script also allows you to choose different data sources for each RSI, offering flexibility in analysis.
Features:
Two RSIs: One with a shorter period and another with a longer period .
Moving Averages: Each RSI has its own configurable moving average . The moving averages help smooth out the RSI and provide clearer trends.
Customizable Inputs: Adjust the RSI period and the length of the moving averages. You can also choose different sources for each RSI (e.g., close, open, high, low).
Mid Line: A horizontal line at 50, which is commonly used as the neutral level for the RSI. It helps identify whether the RSI is above or below neutral, indicating bullish or bearish conditions.
Overbought and Oversold Levels: Horizontal lines at 70 (overbought) and 30 (oversold) to highlight when the asset might be overbought or oversold according to the RSI.
How it works:
RSI Calculation: The script calculates two RSIs using different lengths
Moving Averages: A Simple Moving Average (SMA) is applied to both RSIs to smooth their values and help identify trends.
Overbought/Oversold Indicators: The script includes horizontal lines at 70 and 30 to show overbought and oversold conditions. The mid line is plotted at 50 to highlight neutral levels.
This indicator is useful for traders who want to compare the behavior of two RSIs over different time periods and use the moving averages to filter out noise. The ability to customize the source data for each RSI makes this script adaptable to different trading strategies.

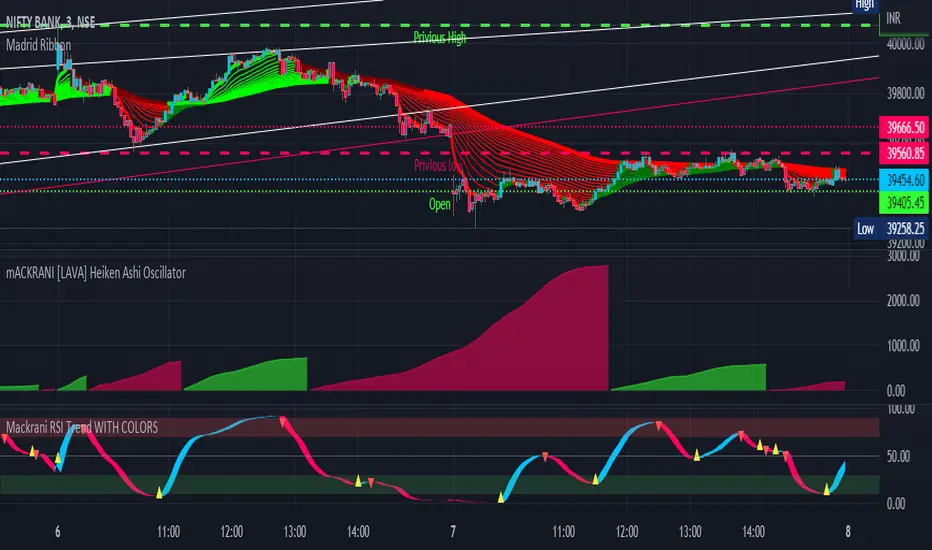
Mackrani RSI Trend WITH COLORSMACKRANI RSI WITH COLORS
Hull Trend is a hybrid indicator with RSI of HULL Signal. The Hull MA is combined with RSI to see if the Hull MA Buy/Sell Signal is in overbought or oversold condition. Buy Sell Signals are plotted based on settings of OB/OS or RSI .
This indicator is very useful to see if the Trend is in Exhaustion or Beginning of a Trend. Entry and Exit conditions can be more precise based on OB/OS condition of price action. In addition normal RSI trend is plotted with trend color from Hull MA. Best Performance with Heiken Ashi Candle
:- OB/OS Settings provided
:- Hull Buy/Sell Signals plotted
:- Double RSI FAST and DEFAULT signal with crossover
:- Bar Color applied based on Hull RSI Trend
:- Hull Trend + RSI + Price Action
RSI TrendRSI Hull Trend is a hybrid indicator with RSI of HULL Signal. The Hull MA is combined with RSI to see if the Hull MA Buy/Sell Signal is in overbought or oversold condition. Buy Sell Signals are plotted based on settings of OB/OS or RSI. This indicator is very useful to see if the Trend is in Exhaustion or Beginning of a Trend. Entry and Exit conditions can be more precise based on OB/OS condition of price action. In addition normal RSI trend is plotted with trend color from Hull MA. Best Performance with Heiken Ashi Candles.
OB/OS Settings provided
Hull Buy/Sell Signals plotted
Double RSI FAST and DEFAULT signal with crossover
Bar Color applied based on Hull RSI Trend
Hull Trend + RSI + Price Action

Noro's Double RSI Strategy 1.0Strategy uses only 2 RSI indicators. Slow and fast.
If slow RSI > 50 and fast RSI < 50 - to open a long-position
If slow RSI < 50 and fast RSI > 50 - to open a short-position
If the long-position is open and a candle green - to close a long-position
if the short-position is open and a candle red - to close a short-position

Dragon Double RSI Overbought-Oversold With LabelThis indicator consist of tow RSI length that user can customize it. like length, overbought, oversold. like length, overbought, oversold. also it has one moving average where the user can select from different types of moving averages, price sources, lookback periods and resolutions
